Ken-Betwa River Linking Project (KBLP)
Introduction
Managing India's water resources is a complex challenge, demanding innovative solutions to address the recurring crises of floods and droughts. The Ken-Betwa River Link Project (KBLP), a major irrigation initiative, represents a significant investment in alleviating water scarcity in the Bundelkhand region (Jain et al., 2019). Traditional monitoring and evaluation methods often struggle to capture the full scope of such large-scale projects. This research leverages the power of remote sensing and cloud computing, employing satellite imagery, the LandTrendR algorithm, and the Google Earth Engine (GEE) platform to analyze land use and land cover changes within the KBLP's influence zone. This technological approach offers a cost-effective and efficient means of assessing the project's impact, guiding future development decisions and ensuring sustainable resource management
Problem Statement
The Ken-Betwa River Link Project (KBLP) aims to alleviate drought in Bundelkhand, but remains unanalyzed. Preliminary data reveals significant water depletion (96 km² to 46.5 km² in 2016), suggesting crop stress. This research uses remote sensing to understand agricultural change patterns for effective irrigation management and KBLP success
Research Questions
1. What's the Impact of this River Link Project on Urban area and Vegetation?
2. How to Monitor, Evaluate the progress of KB River Link Project ?
3. What is the scenario of future land use projection in the river link region?
Objectives of the Study
1. To identify and quantify the yearly changes in the Vegetation area in (sq.km) around the river linking region by analyzing the LULC of the region from 2010-2021.
2. Projection of Land use changes around the river link region in the future scenario using CA-Markov Modelling.
Data & Methods
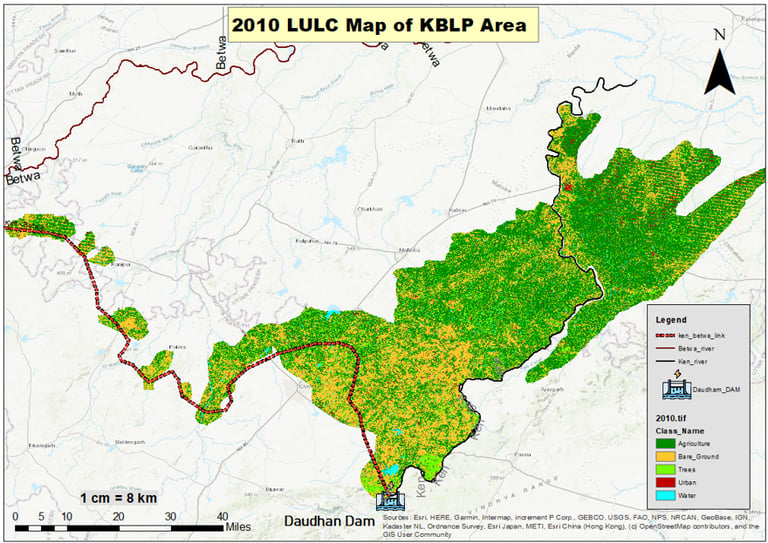
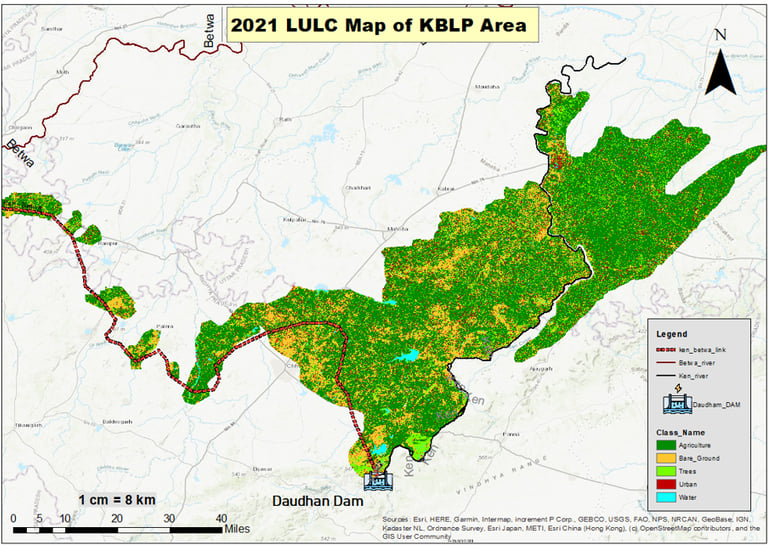
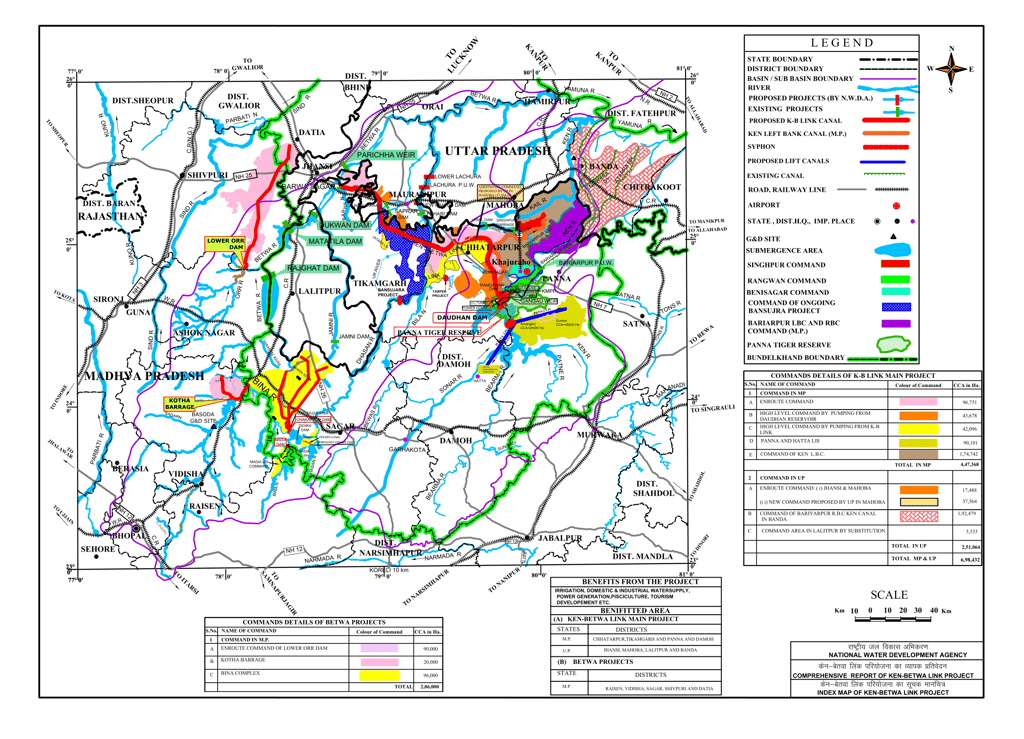
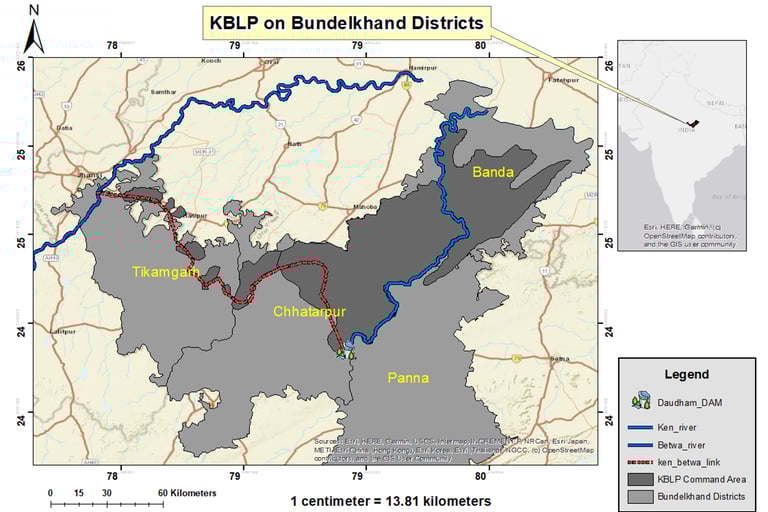
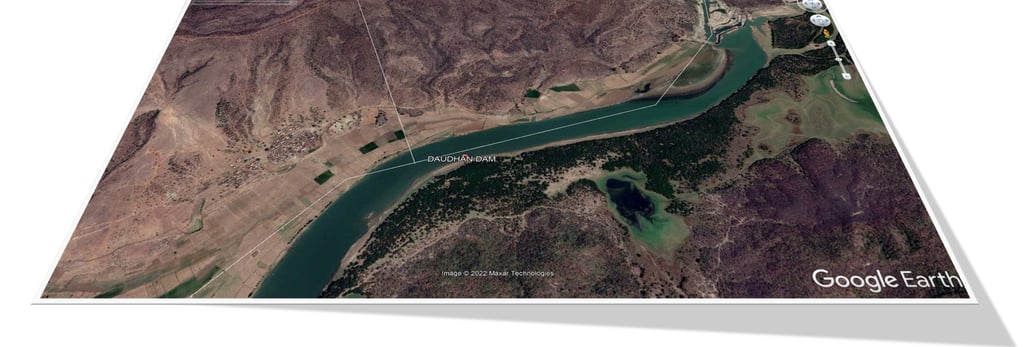
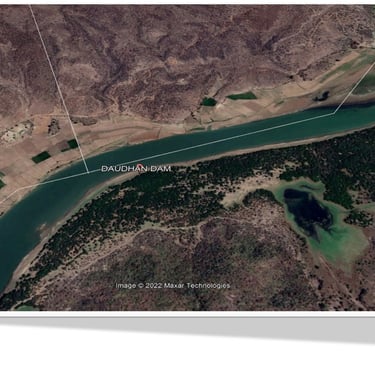
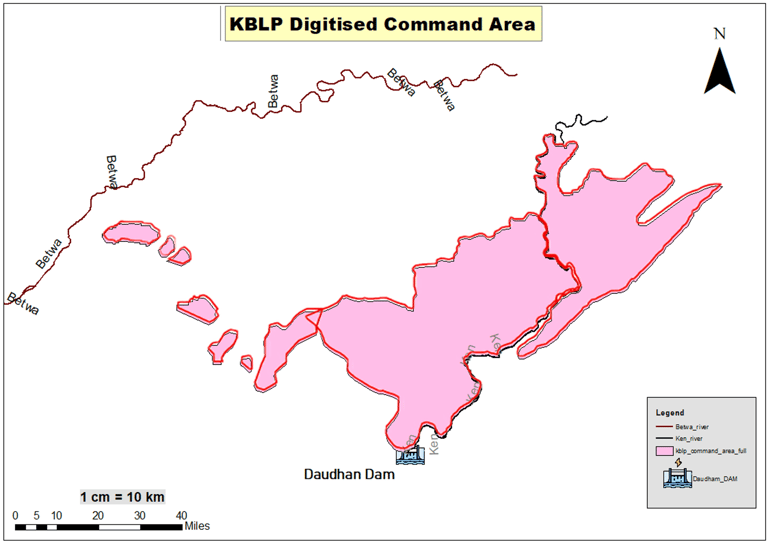
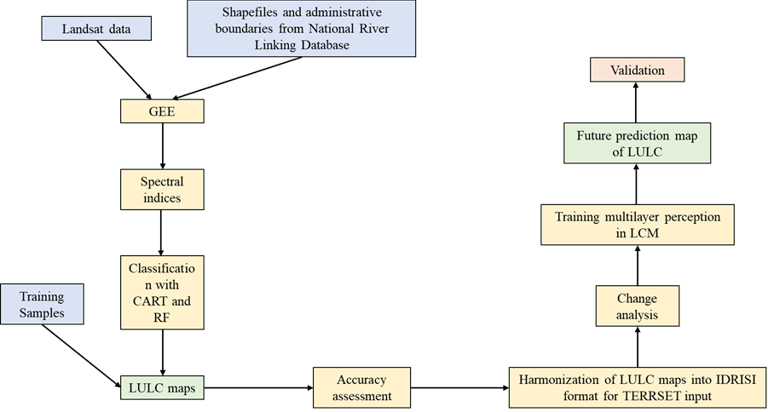
The GEE platform was used for filtering the Landsat 7 ETM+ and Landsat 8 OLI Level 2 product imagery spatially with KBLP boundaries and temporally with temporal timestamps of 2000, 2004, 2008, 2012, 2014, 2018, and 2021. Cloud-free imagery from January is selected for vegetation change over the region. The official shapefiles of the proposed river link and the respective dams on both sides are downloaded from the supplementary material provided by the research done by (Higgins et al., 2018). A detailed study of the reports published by NWDA (National Water Development Agency) and created the accurate shape files of River links, Dams and Reservoirs. Numerous government publications, rasterized maps, analysis and design paperwork, and Open Street Map data have been used to build these datasets (Bagla, 2014).
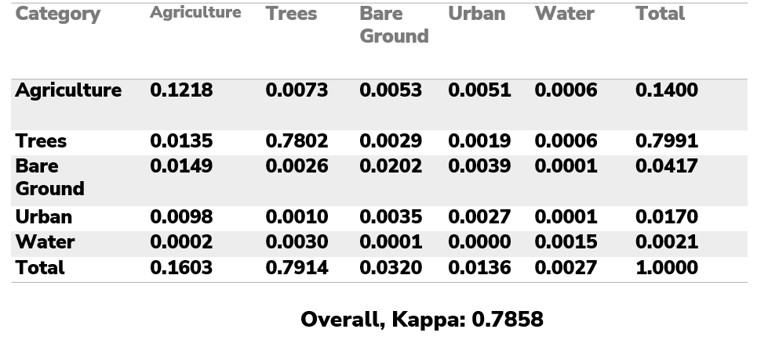
This study assesses land use change in the Ken-Betwa project using a digitized command area map from NDWA data, corrected with Survey of India toposheets in QGIS. Pixel-based supervised classification was performed in Google Earth Engine (GEE) with Random Forest (RF) and Classification and Regression Tree (CART) algorithms for vegetation cover change analysis. Land Change Modeler (LCM) in Terrset software was used for future scenario modeling, employing Multi-Layer Perceptron (MLP) and Markov chains. Driving factors like DEM, slope, water, roads, agriculture, and urban areas were selected based on Cramer's V values, with MLP analyzing their relationship to transition potential maps for change prediction. This methodology enables a comprehensive assessment of land use dynamics in the project area.
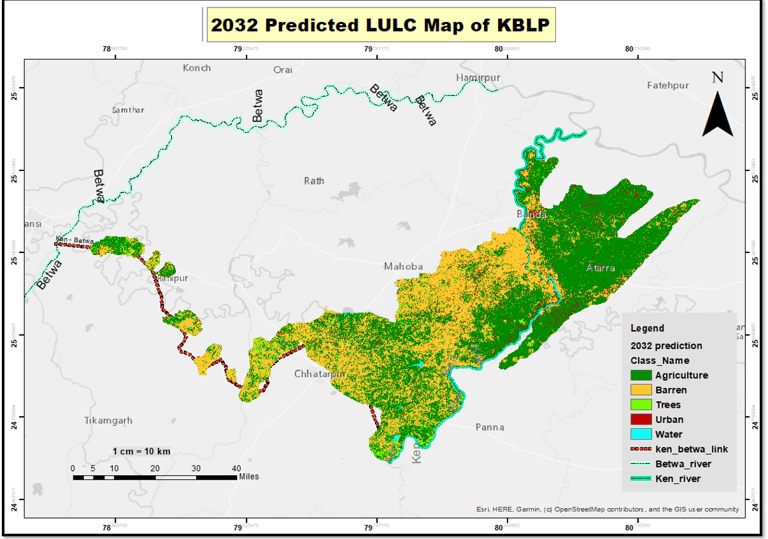
Results and Conclusions
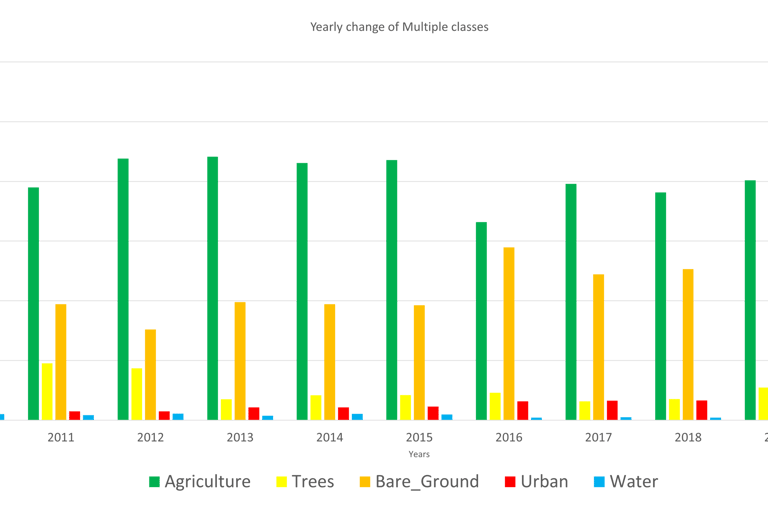
This research assessed the Ken-Betwa River Link Project's (KBLP) impact on land use and land cover (LULC) across four districts, revealing an unstable trend of agricultural gain offset by water scarcity. A concerning depletion of water features, highlighted by a decline from 96 km2 to 46.5 km2 in 2016, correlates with increased barren land and potential crop stress, particularly in Chhatarpur. Future modeling to 2032, aligned with the project's targeted completion, indicates a concerning trend of increasing barren lands, emphasizing the need for effective monitoring and evaluation (M&E) systems. While RF outperformed CART in LULC classification, analysis showed urban growth, agricultural decline after 2015, and steady waterbody reduction. Ultimately, this study provides crucial insights for policymakers to evaluate the KBLP's impact, promote agro-based industries, and ensure sustainable water resource management in the Bundelkhand region.